AI Automation ROI in Morocco: The Productivity J-Curve
New 2026 OECD and World Bank data shows AI productivity follows a J-curve. Moroccan businesses using 12-month ROI models are structurally underestimating automation returns.
Abstract
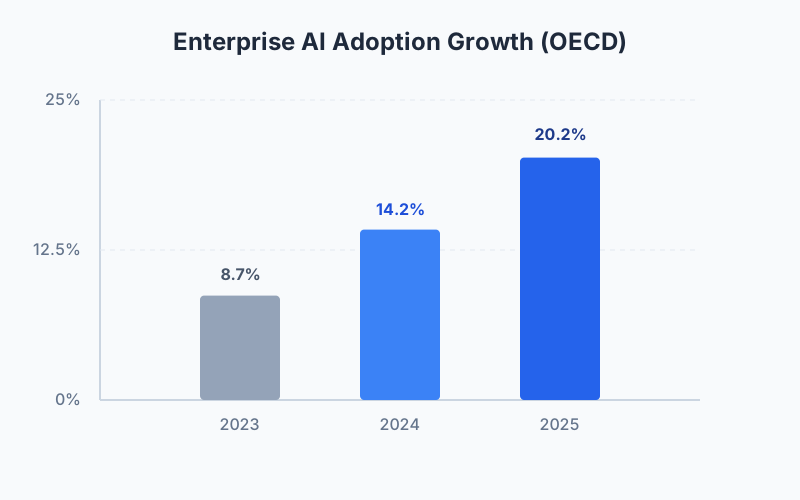
Recent 2026 OECD and World Bank data show AI productivity gains follow a non-linear trajectory, known as the J-curve. Moroccan businesses using 12-month ROI frameworks to judge automation projects are missing the point. This article explains why measuring automation ROI with annual metrics leads to structurally underestimating returns. Based on the surge in firm AI adoption (from 8.7% in 2023 to 20.2% in 2025 per the OECD) and World Bank analyses, CoreMedia proposes a tailored measurement framework for the Moroccan context to capture the true value of your technological investments.
Selected clients, published with permission. More references will be added after approval.
1. The ROI question that's killing Moroccan automation projects
It's a familiar scene in many boardrooms across Casablanca or Rabat. A digital transformation director presents an ambitious process automation project. The project promises to reduce repetitive tasks, accelerate data processing, and improve customer satisfaction. But inevitably, the CFO asks the fateful question: "What will be the return on investment (ROI) by the end of this fiscal year?"
This demand for immediate profitability is understandable. Moroccan companies often operate with constrained budgets and strict 12 to 24-month bank payback requirements. However, applying this standard evaluation model to artificial intelligence and automation investments almost always leads to the defunding of promising projects. Leaders demand tangible proof of success in the first 12 months, and when it fails to materialize, the funding is cut.
What these executive committees ignore is that the trajectory of technological productivity is not linear. It follows what economists call the "J-curve." The initial investment creates operational disruption that temporarily depresses measured productivity, before generating exponential returns in the medium term. By measuring automation with an annual stopwatch, Moroccan companies are structurally depriving themselves of the most significant productivity gains.
2. What the World Bank and OECD are saying about AI productivity in 2026
To understand the scale of the misunderstanding, we must look to global macroeconomic data. Artificial intelligence is no longer an experimental technology. AI adoption among firms in OECD countries reached 20.2% in 2025, up from 14.2% in 2024 and 8.7% in 2023, more than doubling in two years (OECD, 2026a). This is unprecedented technological acceleration.
Yet, despite this massive enthusiasm, overall measured productivity struggles to take off in official statistics. This is the famous "productivity paradox." How can such powerful technology be adopted so quickly without generating an immediate economic boom? World Bank analysis suggests developing economies face a productivity paradox where AI adoption accelerates while measured productivity remains flat, consistent with the J-curve hypothesis (World Bank, 2026).
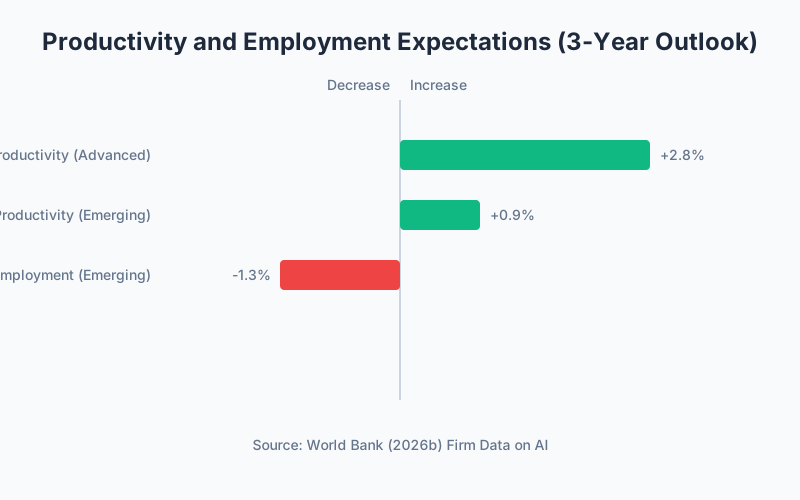
Moreover, businesses themselves feel these frictions. Firm-level data shows that businesses expect AI to lower employment by 1.3% over the next 3 years (cumulative), similar to expectations at the beginning of 2026, reflecting the initial challenges of reorganization and skills adaptation (World Bank, 2026b). However, the long-term gains are real: in the central scenario, AI-driven productivity gains vary widely across countries and are expected to raise per capita real income growth by 0.1–0.95 percentage points (OECD, 2026c).
Figure 1: Enterprise AI adoption has more than doubled in two years. Source: OECD (2026a).
3. The productivity J-curve explained
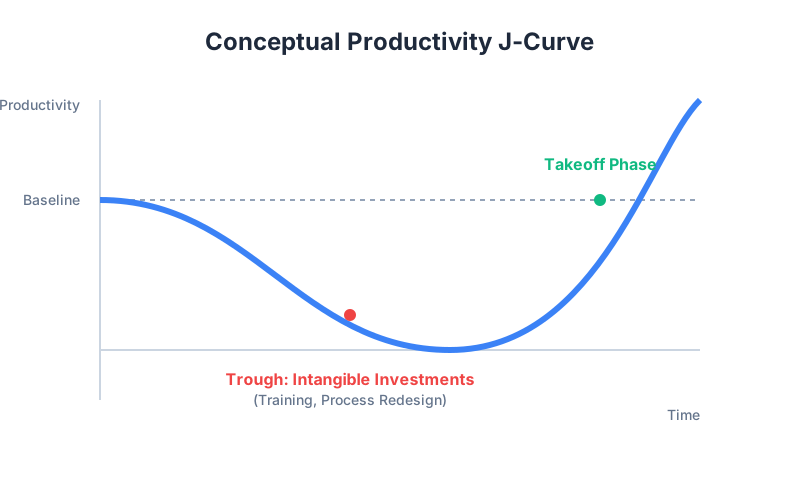
The productivity J-curve describes how general purpose technologies like AI initially depress measured productivity as organizations invest in complementary intangibles, process redesign, worker retraining, organizational restructuring, before generating accelerating returns (Brynjolfsson, Rock and Syverson, 2021, pp. 333–337).
Unlike buying a new server that works immediately, integrating AI requires profound transformation. During the initial phase, companies spend financial capital and human time without seeing additional output. Employees must learn new tools, processes must be rewritten, and old methods are maintained in parallel for safety. Mathematically, productivity (output divided by input) drops.
What makes AI unique is its capacity for autonomy and self-improvement, which could accelerate innovation and potentially revive sluggish productivity growth (Filippucci et al., 2024, p. 7). Once the adaptation phase is over, the systems learn, employees rely on AI for increasingly complex tasks, and the curve shoots upward.
Figure 2: The theoretical productivity J-curve for general purpose technologies. Initial intangible investments create a productivity deficit before acceleration. Source: Adapted from Brynjolfsson, Rock and Syverson (2021).
4. Why the standard 12-month ROI model fails for automation
The fundamental problem lies in our accounting and financial methods. Standard investment evaluation in Morocco, and elsewhere, relies on annual budgeting cycles. Finance departments demand short-term positive cash flow forecasts. However, theoretical analysis shows that traditional productivity measurement omits the accumulation of intangible capital during the investment period (Brynjolfsson, Rock and Syverson, 2021, pp. 340–345).
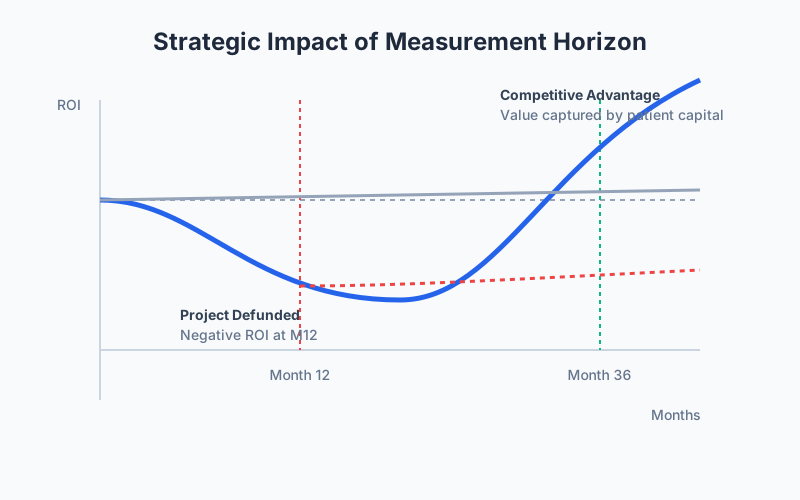
If a Moroccan CFO evaluates the AI automation project at month 12, they are exactly in the trough of the J-curve. Costs for training, software integration (like n8n), and process redesign are at their peak, while efficiency gains are just beginning to materialize. By applying a standard discount rate to this truncated cash flow, the project appears to be a resounding financial failure.
This temporal bias is devastating. It systematically penalizes the most structural digital transformation Morocco projects in favor of small marginal optimizations that yield little, but quickly. To succeed, Moroccan businesses must lengthen their measurement horizon.
5. What Moroccan businesses can learn from global adoption data
Although the Moroccan High Commission for Planning (HCP) collects excellent economic data, there are no specific national statistics yet on the impact of AI on Moroccan enterprise productivity. Faced with this gap, we must use global data as a proxy and make editorial inferences to guide strategic action.
World Bank firm data (World Bank, 2026b) indicates that in emerging economies, productivity expectations follow the logic of the J-curve, with anticipated workforce reductions (1.3% over three years) linked to restructuring rather than immediate massive output gains. Simultaneously, the cross-country dispersion of productivity gains (0.1–0.95 percentage points) demonstrates that economies investing heavily in skills and reorganization will capture the bulk of the value (OECD, 2026c).
Based on these international patterns (OECD, 2026a), it is an editorial estimate that Moroccan companies treating AI not merely as software but as organizational capital investment will traverse the J-curve trough faster and reap disproportionate rewards.
Figure 3: AI-related productivity and employment expectations from enterprise surveys. Source: World Bank (2026b).
5.1 The data we have, and the data Morocco still needs
It is important to transparently acknowledge our analytical limits. The lack of specific Moroccan AI productivity data is a challenge. The HCP digital transformation program (HCP, 2026) is building the data infrastructure for the future, but for now, leaders are flying blind. According to OECD frameworks (OECD, 2025), precise measurement requires rigorous national surveys on technology adoption and firm-level intangible investments. Moroccan business leaders should advocate for the creation of these national indicators to refine their competitiveness strategies.
6. Sector-specific J-curve patterns relevant to Morocco
Not all sectors navigate the J-curve at the same speed or intensity. Sector-level analysis (OECD, 2026c) and task-level AI exposure (Filippucci et al., 2024, pp. 25–35) show highly contrasting dynamics.
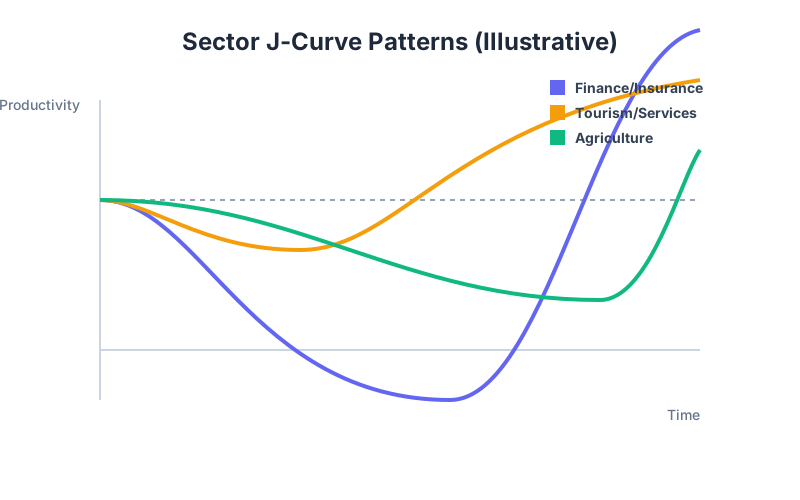
In the Moroccan context, we estimate sector impact based on global trends (World Bank, 2026). The financial services sector (Casablanca Finance City) and insurance are highly exposed to cognitive technologies. Their J-curve will be deep because regulatory and compliance processes require total redesign before unleashing automation. In contrast, Moroccan tourism might experience a flatter and shorter curve for simple applications (automated customer service), but a complex curve for dynamic pricing hyper-personalization.
Export agriculture, a pillar of the Moroccan economy, could experience the longest J-curve, as integrating AI with field agronomic and weather data requires massive physical and training investments.
Figure 4: Comparative J-curve profiles by business sector, illustrating the variability of required complementary investments. Morocco application is an editorial estimate based on economic structure. Sources: OECD (2026c), World Bank (2026).
7. A practical measurement framework for Moroccan automation projects
Since the 12-month model is flawed, what should replace it? CoreMedia advocates a three-phase measurement framework, adapted from OECD measurement recommendations (Filippucci et al., 2024, pp. 40–45) and enterprise strategy data showing 79% of enterprises already run AI agents (PwC, 2025, as reported by Ekfrazo, 2026).
This framework allows Moroccan leaders to steer digital transformation while reassuring their finance committees, aligning indicators with the temporal reality of technological deployment.
7.1 Phase 1, Investment and setup (Months 0–6)
During this operational disruption phase, do not try to measure financial ROI. Instead, track adoption and implementation quality metrics. Measure the percentage of mapped processes, the number of trained employees, and the integrity of the data infrastructure established. This is the invisible intangible investment.
7.2 Phase 2, Process adaptation (Months 6–18)
This is where most Moroccan companies give up. To justify continuing the project, track leading indicators: reduction in error rates, decreased cycle time for specific tasks (like invoice processing), and increased employee proficiency and satisfaction. These metrics prove the system works, even before net financial savings are consolidated.
The J-curve finally turns upward. Now is the time to apply classic financial metrics: increased revenue per employee, overall reduction in operational costs, and net margin growth. This is the yield phase of business automation Morocco.
8. The cost of measuring wrong, what Moroccan businesses stand to lose
Why is it vital to adopt this new measurement framework? Because strategic evaluation errors are costly. OECD models (OECD, 2026c) forecast significant income growth through AI. If you kill a project at month 12 because it isn't profitable, you leave all the Phase 3 gains to your competitors.
Industry reporting suggests professionals using AI productivity tools save approximately one workday per week (Stellium Consulting, 2026, reporting LSE research, though the original LSE paper was not independently verified for this article). This compounded efficiency creates an insurmountable productivity gap (World Bank, 2026). A Moroccan SME that successfully navigates the J-curve acquires agility and a cost structure that allows it to displace short-sighted rivals, creating a decisive competitive advantage (PwC, 2025).
Figure 5: The strategic impact of the measurement horizon. Firms judging on 12 months abandon at the trough, leaving long-term growth to competitors judging on 36 months. Illustrative scenario based on OECD (2026c) and PwC (2025) data.
9. Risks, governance, and the limits of the J-curve
It is crucial to exercise intellectual honesty: not all failures are simply "J-curve troughs." Sometimes the technology is inadequate or change management is disastrous. Brynjolfsson, Rock, and Syverson (2021, pp. 360–365) note that if complementary investments are misdirected, productivity will never recover.
Governance is essential to avoid escalating commitment to a failing project (Filippucci et al., 2024, pp. 55–60). Leaders must distinguish a productivity drop due to active learning (healthy) from a drop due to system rejection by employees (fatal). If Phase 2 leading indicators don't improve after 12 months, it's not a J-curve effect; it's an execution failure requiring urgent intervention from your AI agency Morocco.
10. Conclusion, A conversation every Moroccan boardroom needs to have
The message for Moroccan decision-makers is clear: measuring technological productivity requires strategic patience and analytical rigor. Evaluating AI automation with a 12-month financial thermometer guarantees massively underestimating returns and discouraging vital innovation.
At your next budget cycle or board meeting, change the parameters of the discussion. No longer accept evaluating digital transformation without budgeting for intangible investments and extending the measurement horizon to 36 months. CoreMedia is your strategic partner to design these measurement roadmaps and guide you through the complexity of the J-curve.
Brynjolfsson, E., Rock, D. and Syverson, C. (2021) 'The Productivity J-Curve: How Intangibles Complement General Purpose Technologies', American Economic Journal: Macroeconomics, 13(1), pp. 333–372. DOI: Open DOI ↗
Filippucci, F. et al. (2024) The impact of Artificial Intelligence on productivity, distribution and growth. OECD Publishing. URL: View source ↗
HCP (2026) Programme de transformation digitale. Haut-Commissariat au Plan. URL: View source ↗
OECD (2025) The Adoption of Artificial Intelligence in Firms. OECD Publishing, 2 May. URL: View source ↗
OECD (2026a) 'AI use by individuals surges across the OECD as adoption by firms continues to expand', OECD Newsroom, 28 January. URL: View source ↗
OECD (2026c) AI meets trade: Global linkages and the cross-country distribution of AI-driven productivity gains. OECD Publishing, 18 March. URL: View source ↗
PwC (2025) '2026 AI Business Predictions', PwC Tech Effect, 26 November. As reported by Ekfrazo (2026). URL: View source ↗